Context
Something's up with Aperture Labs' new phone, and UX researcher Dottie's on the case. Armed with 100 escalated support ticket conversations from across the globe—half from North America, half from APAC—she's digging in to find out exactly what's going wrong with the hardware.
Mapping the problem space
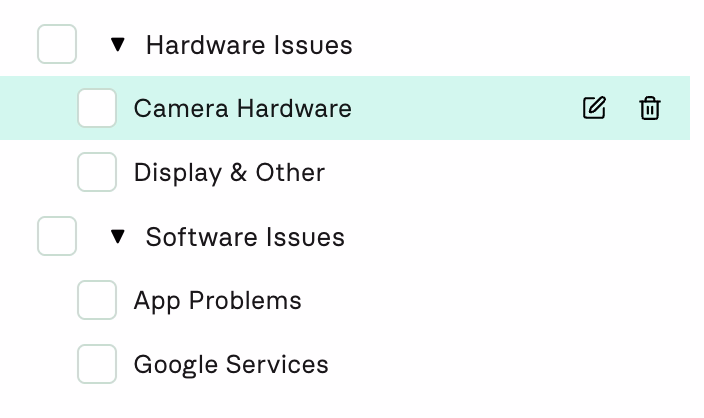
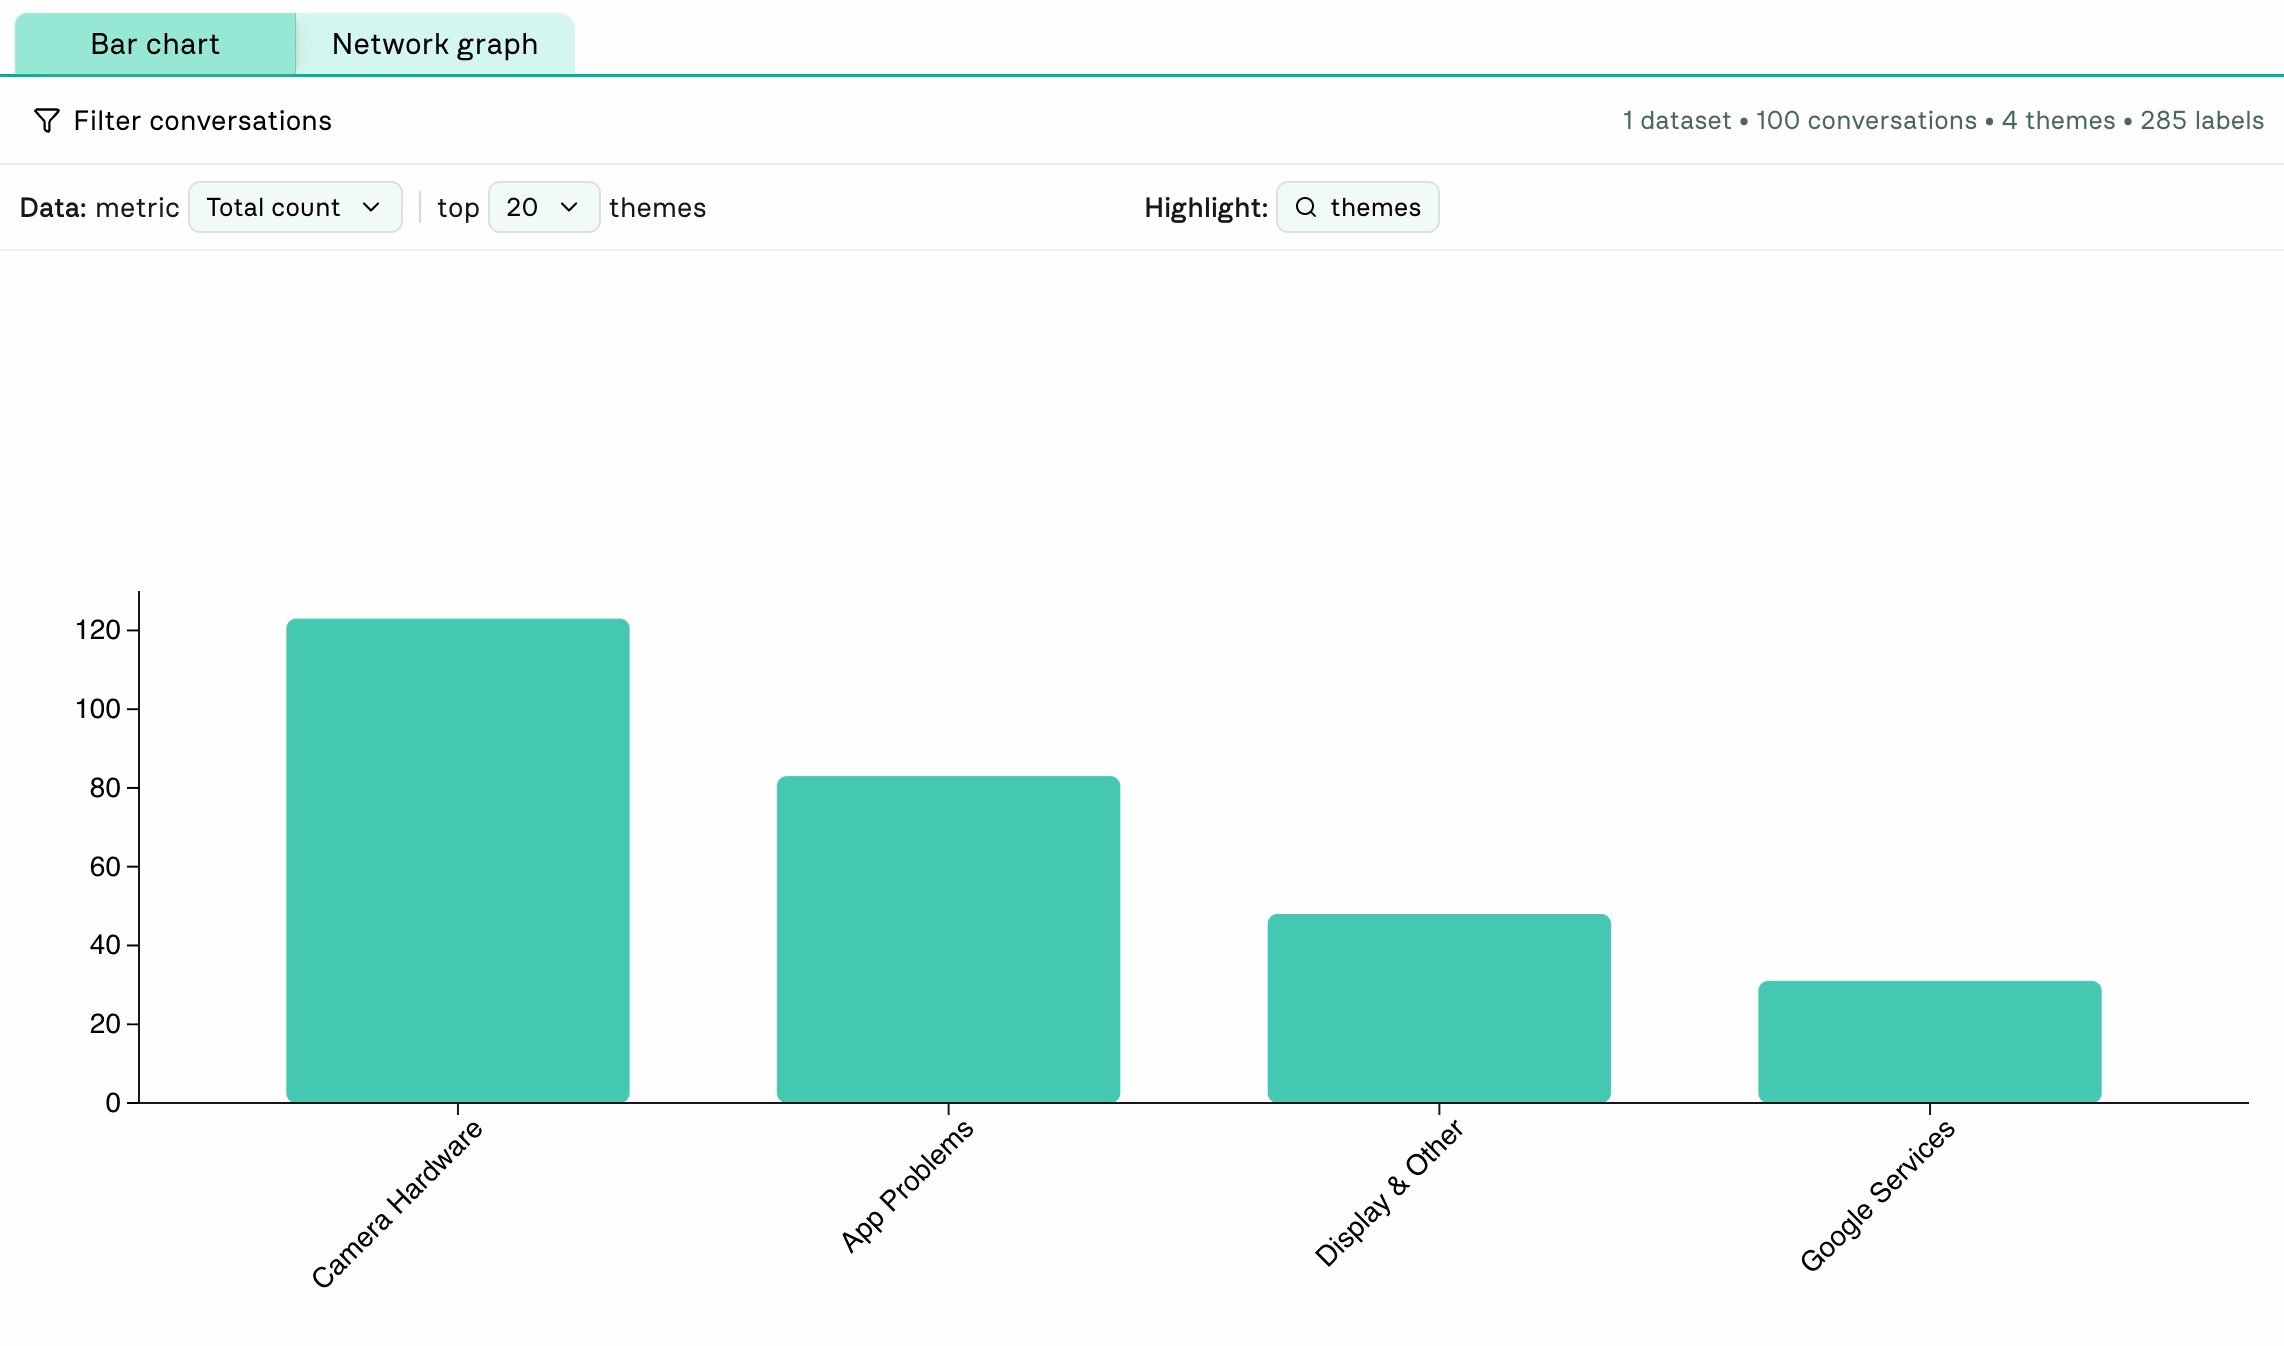
Since Dottie doesn't know what's buried in those 100 conversations yet, she starts broad. She creates two high-level theme groups—hardware and software—each with two general themes, giving her a bird's-eye view of what categories of problems customers are running into.
One theme jumps out: Camera Hardware accounts for 42.8% (122 labels) of all labels.
Zooming in on camera problems
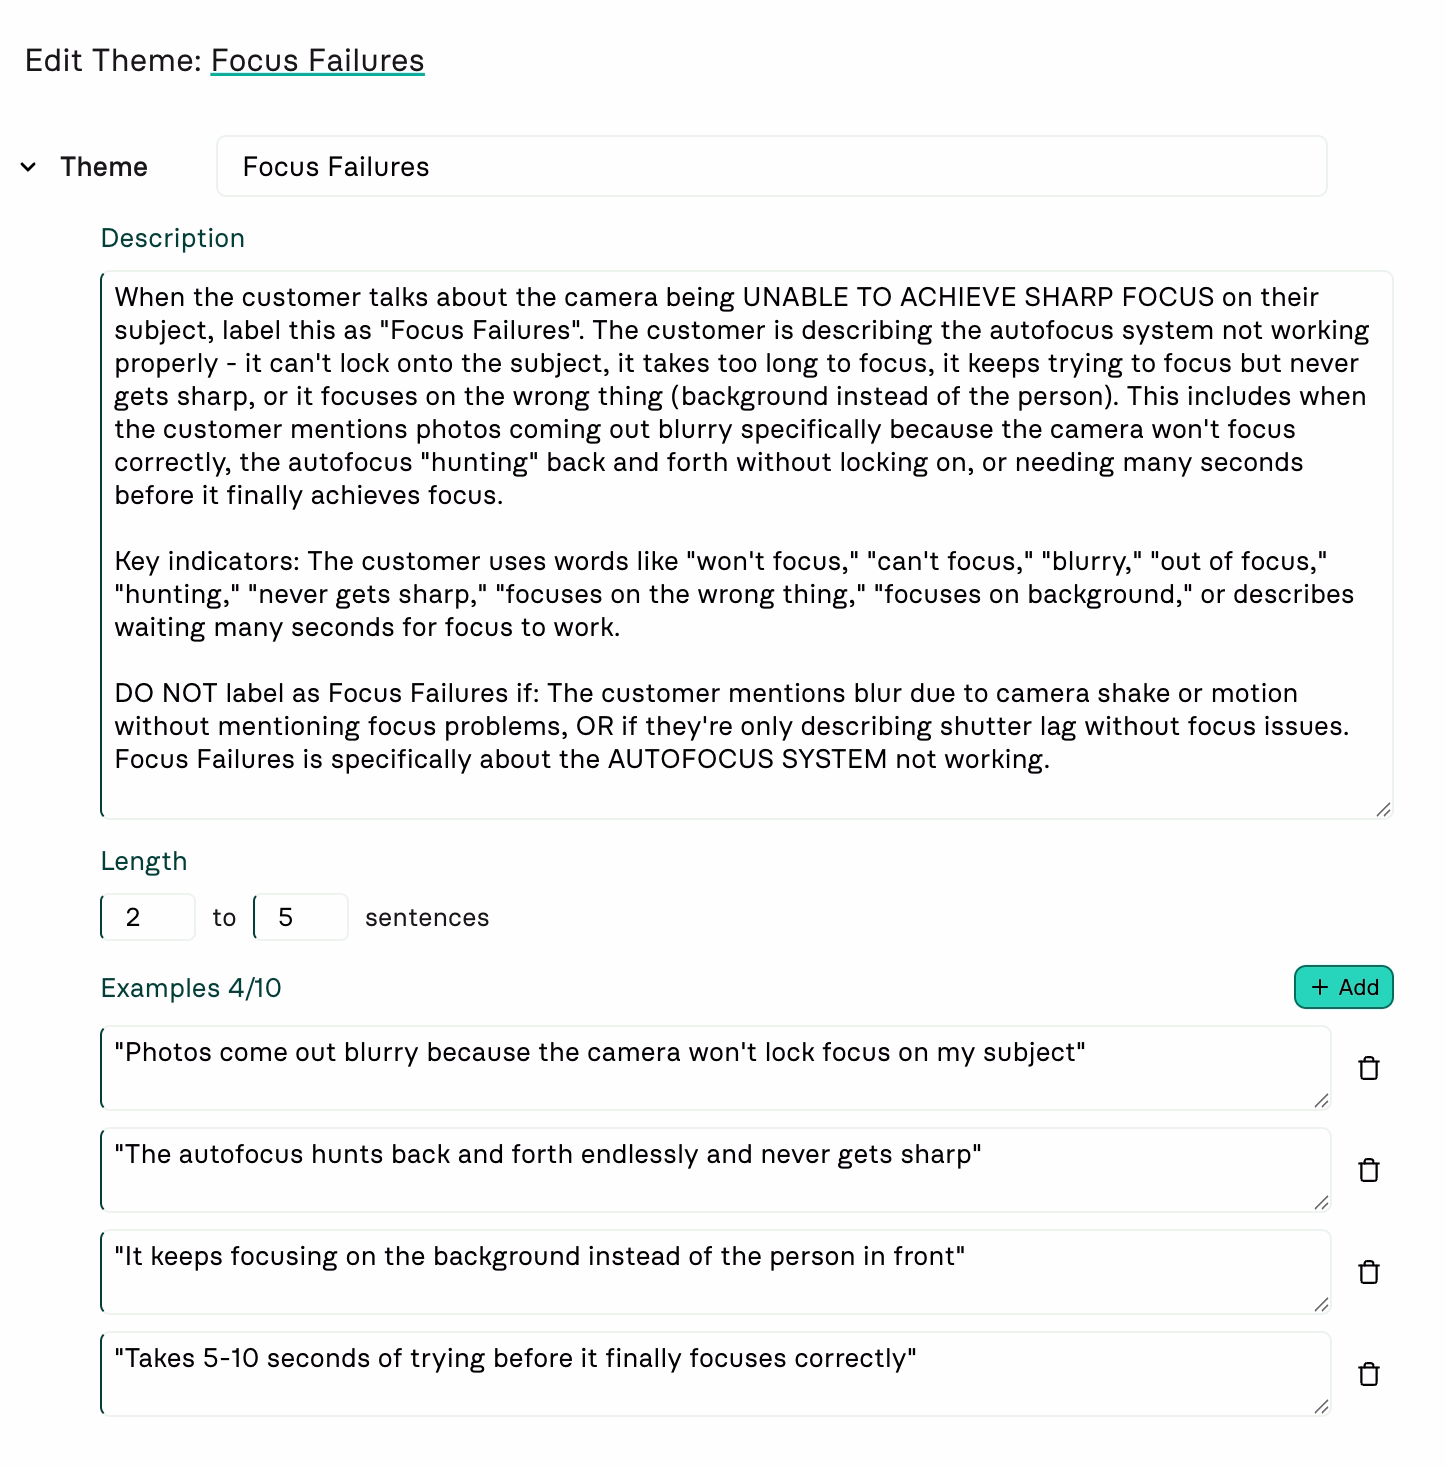
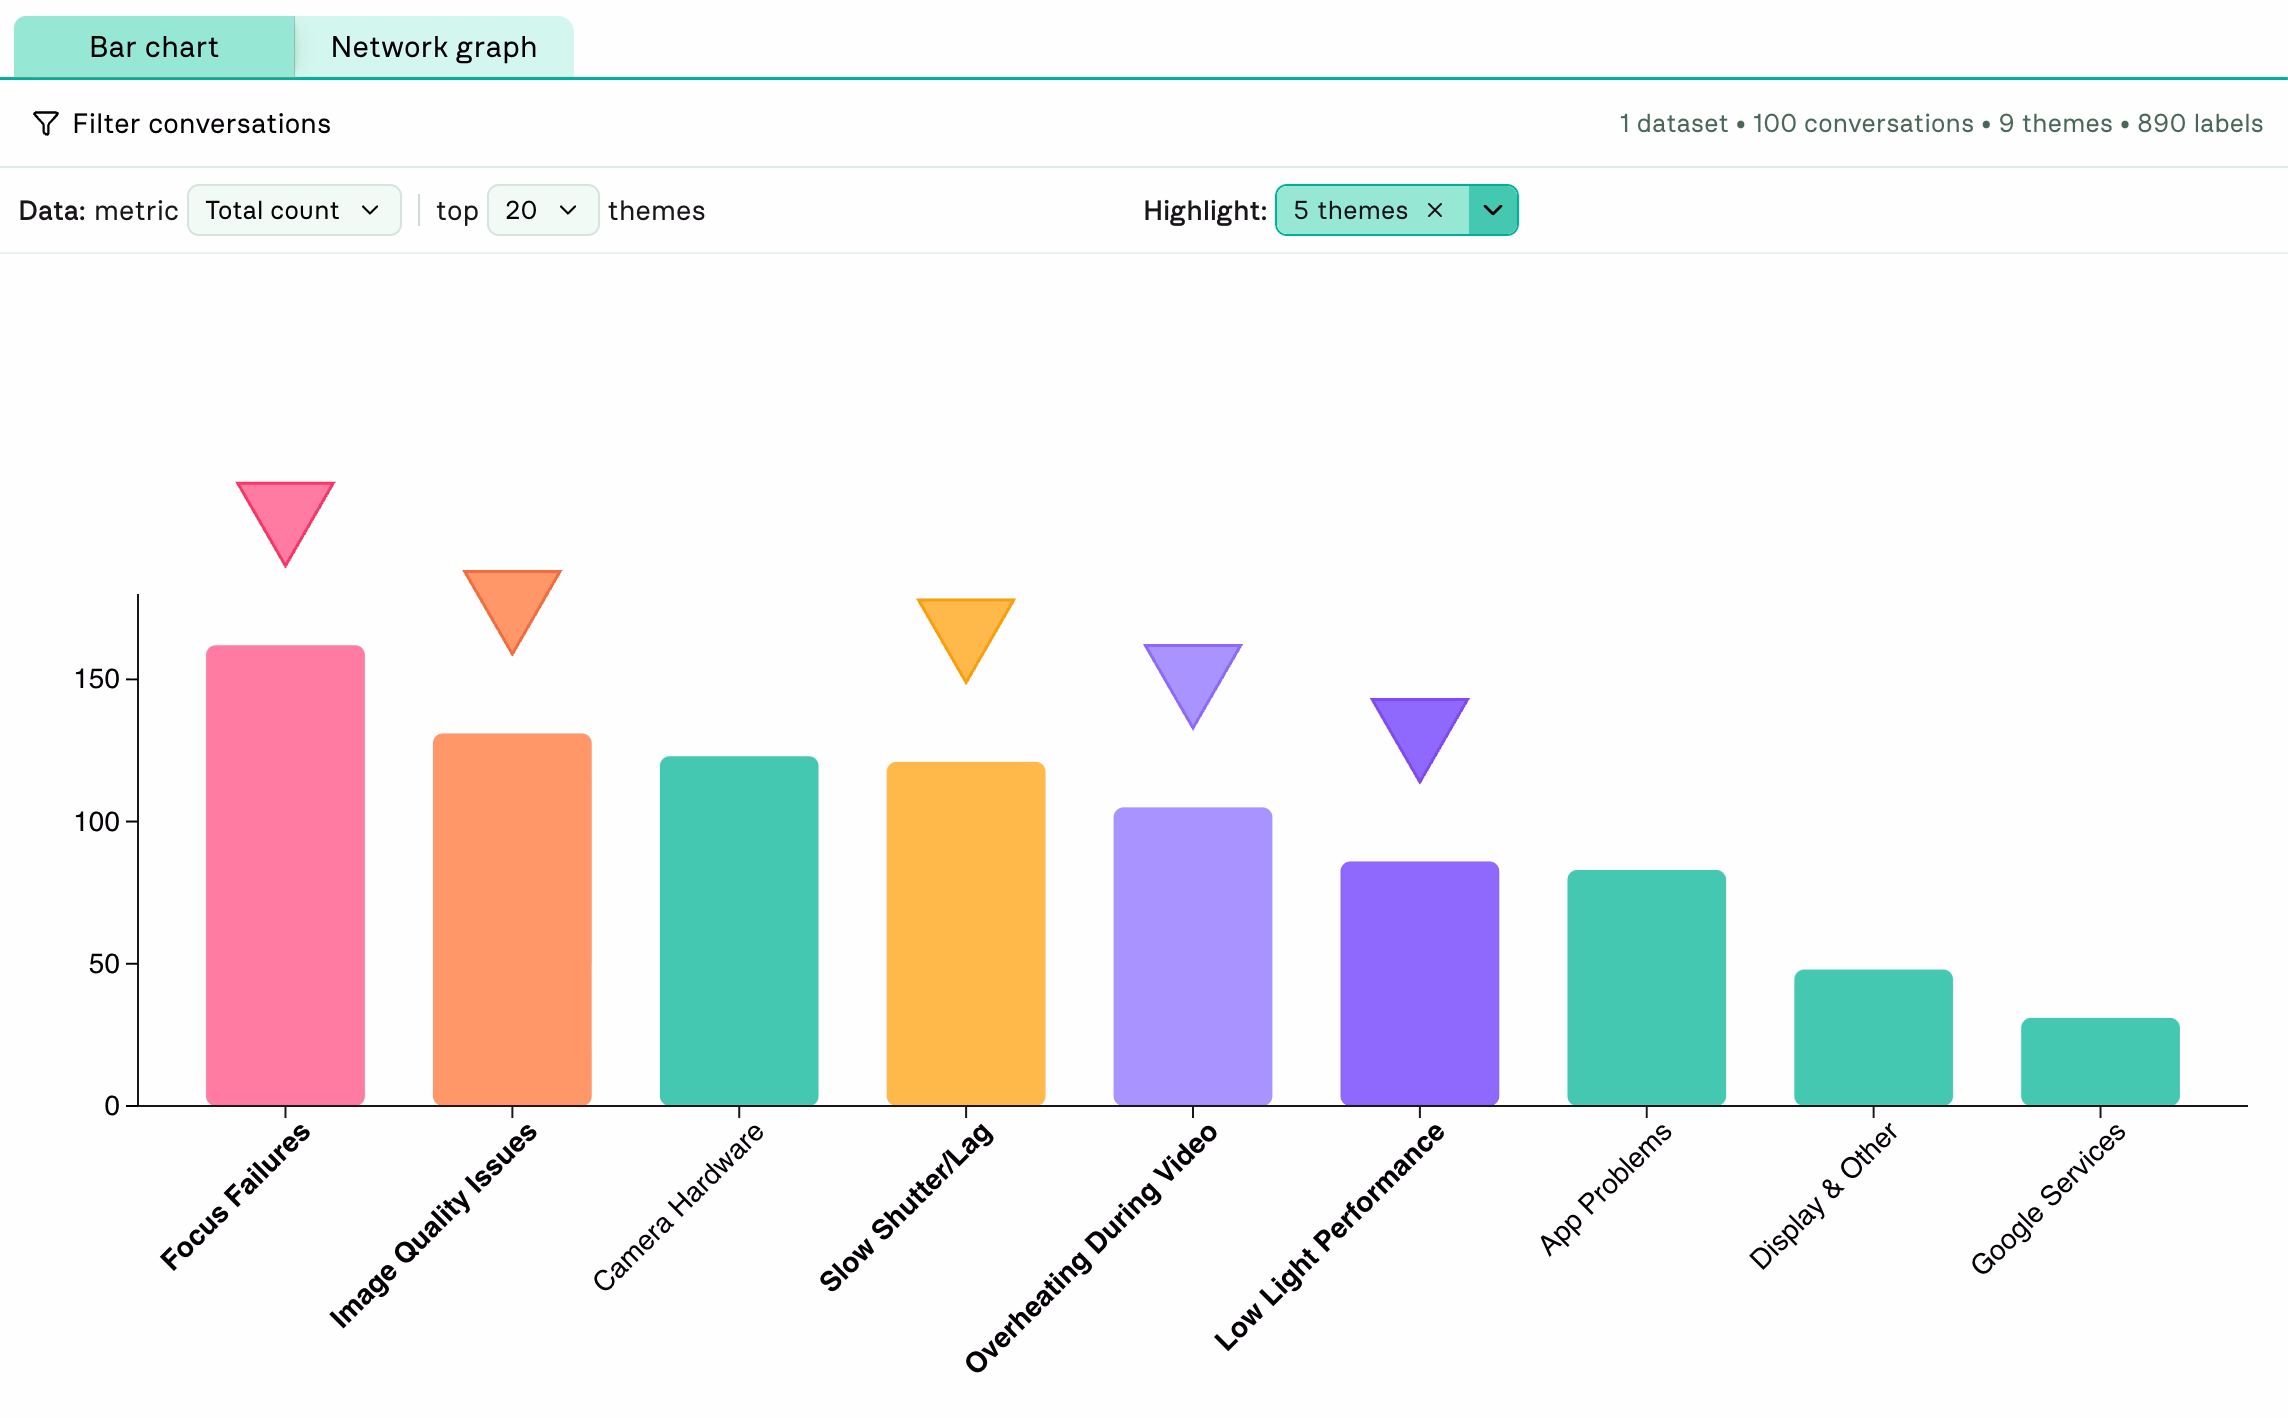
Dottie does her homework—reviewing field reports and checking in with customer success—then creates five new themes around the most common camera issues. Each one includes a full description and examples to keep the labels accurate.
For example, here's the details for theme Focus Failure:
Dottie runs the five camera themes against her dataset. Focus Failure takes the lead in total labeled moments.
Finding patterns across camera themes
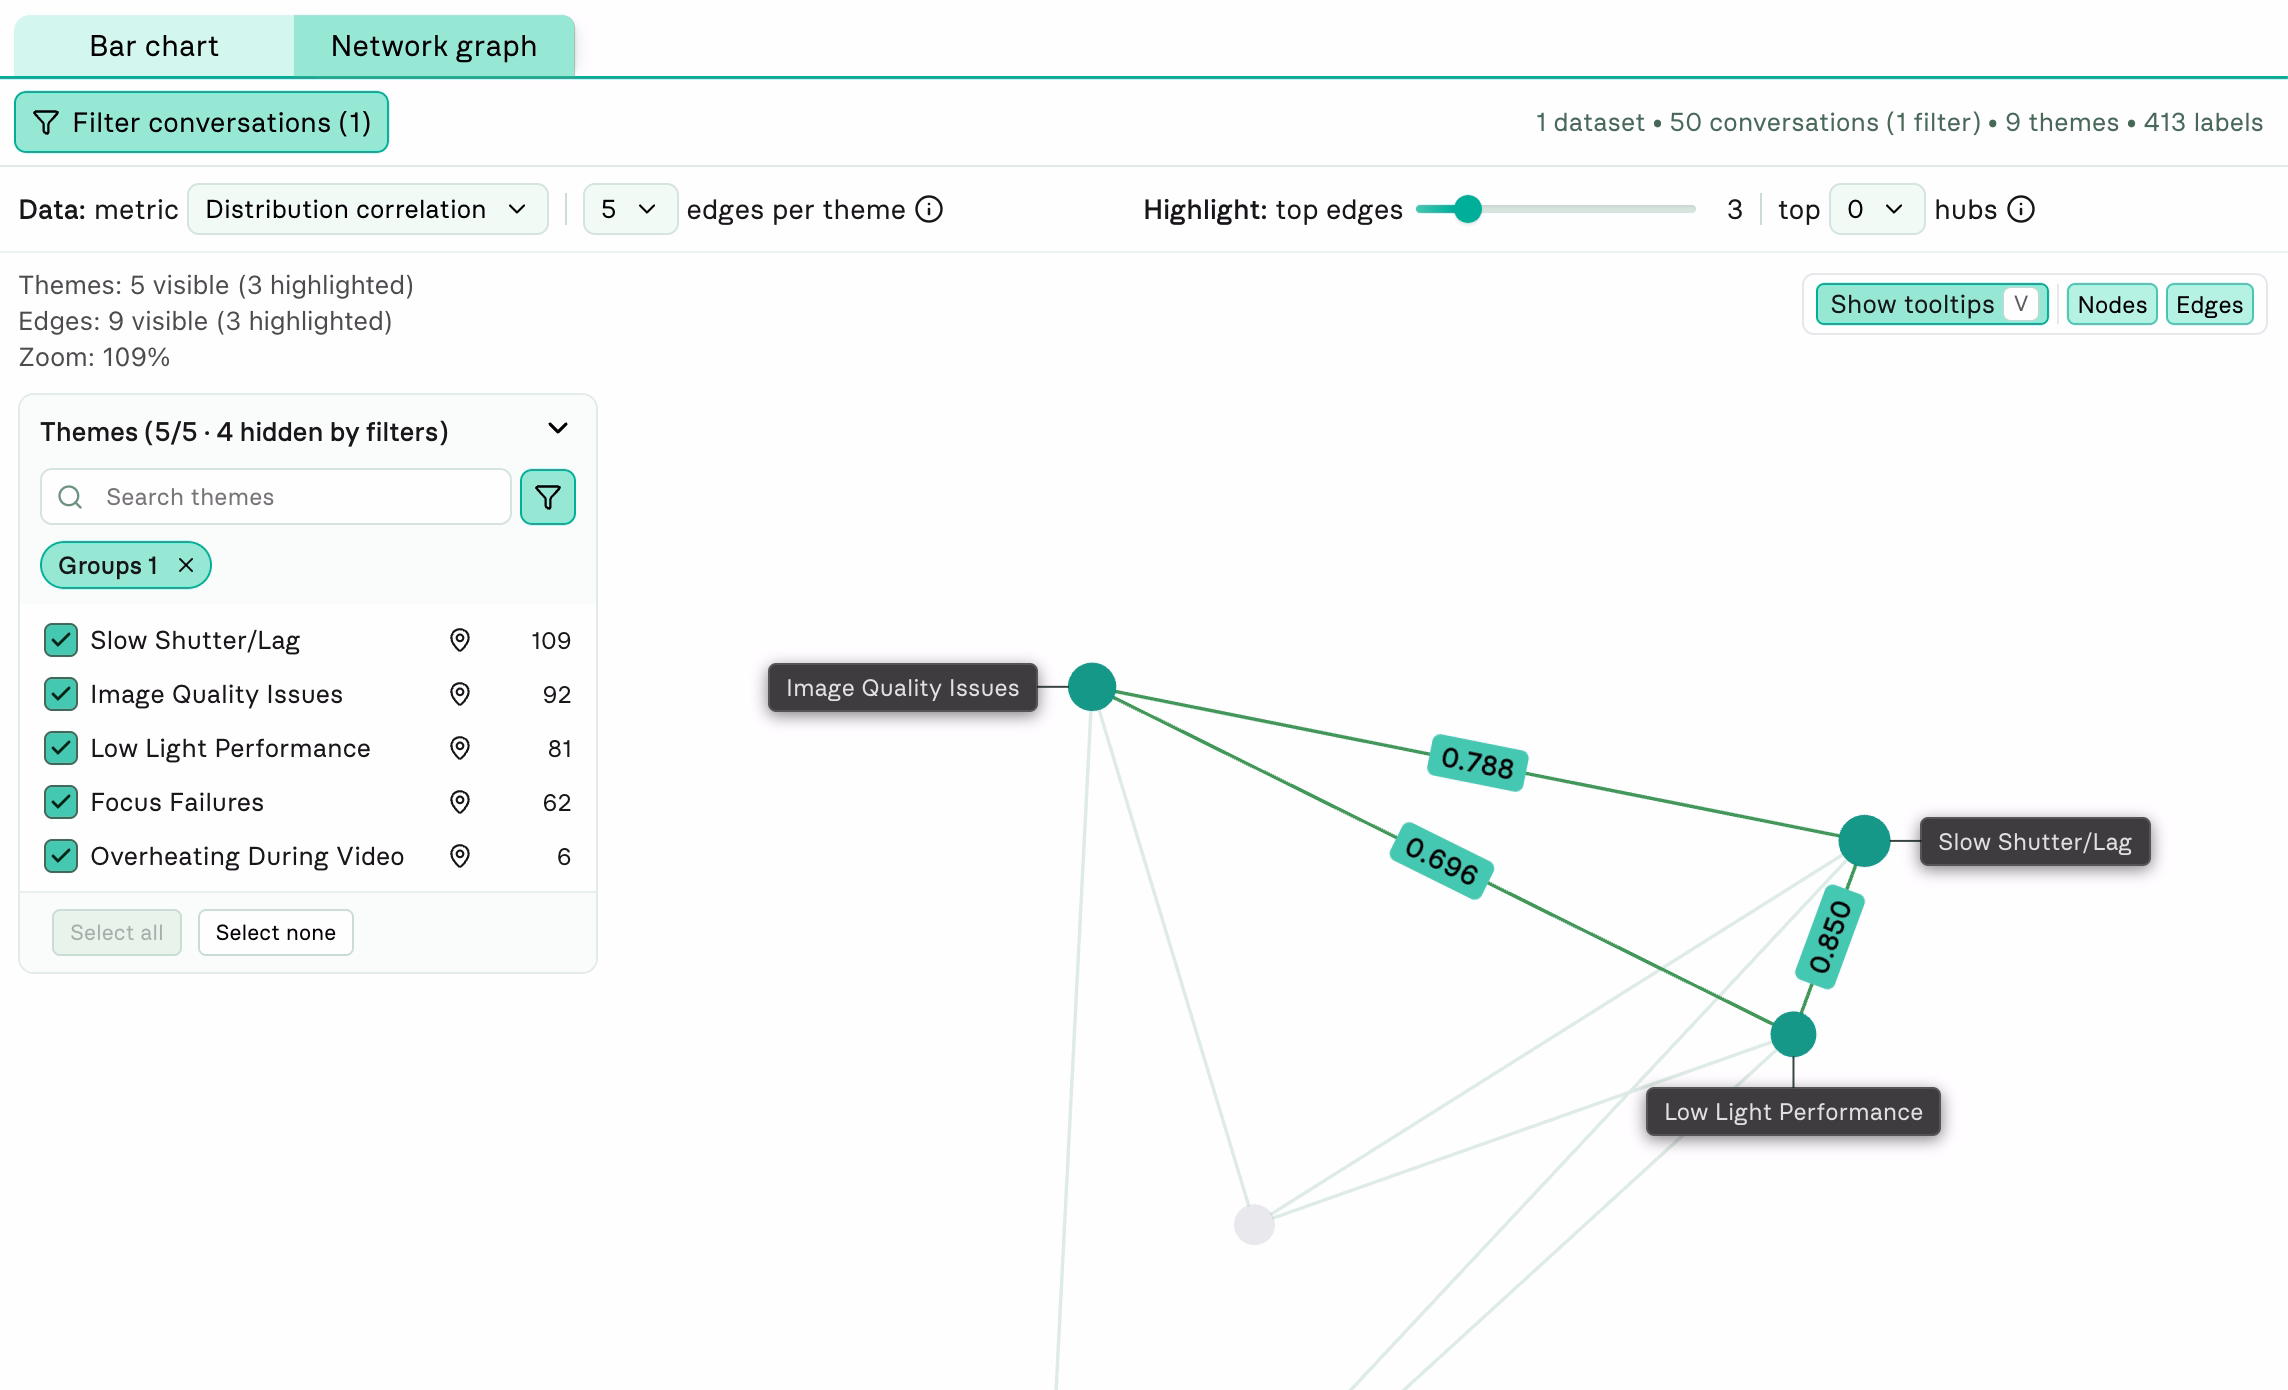
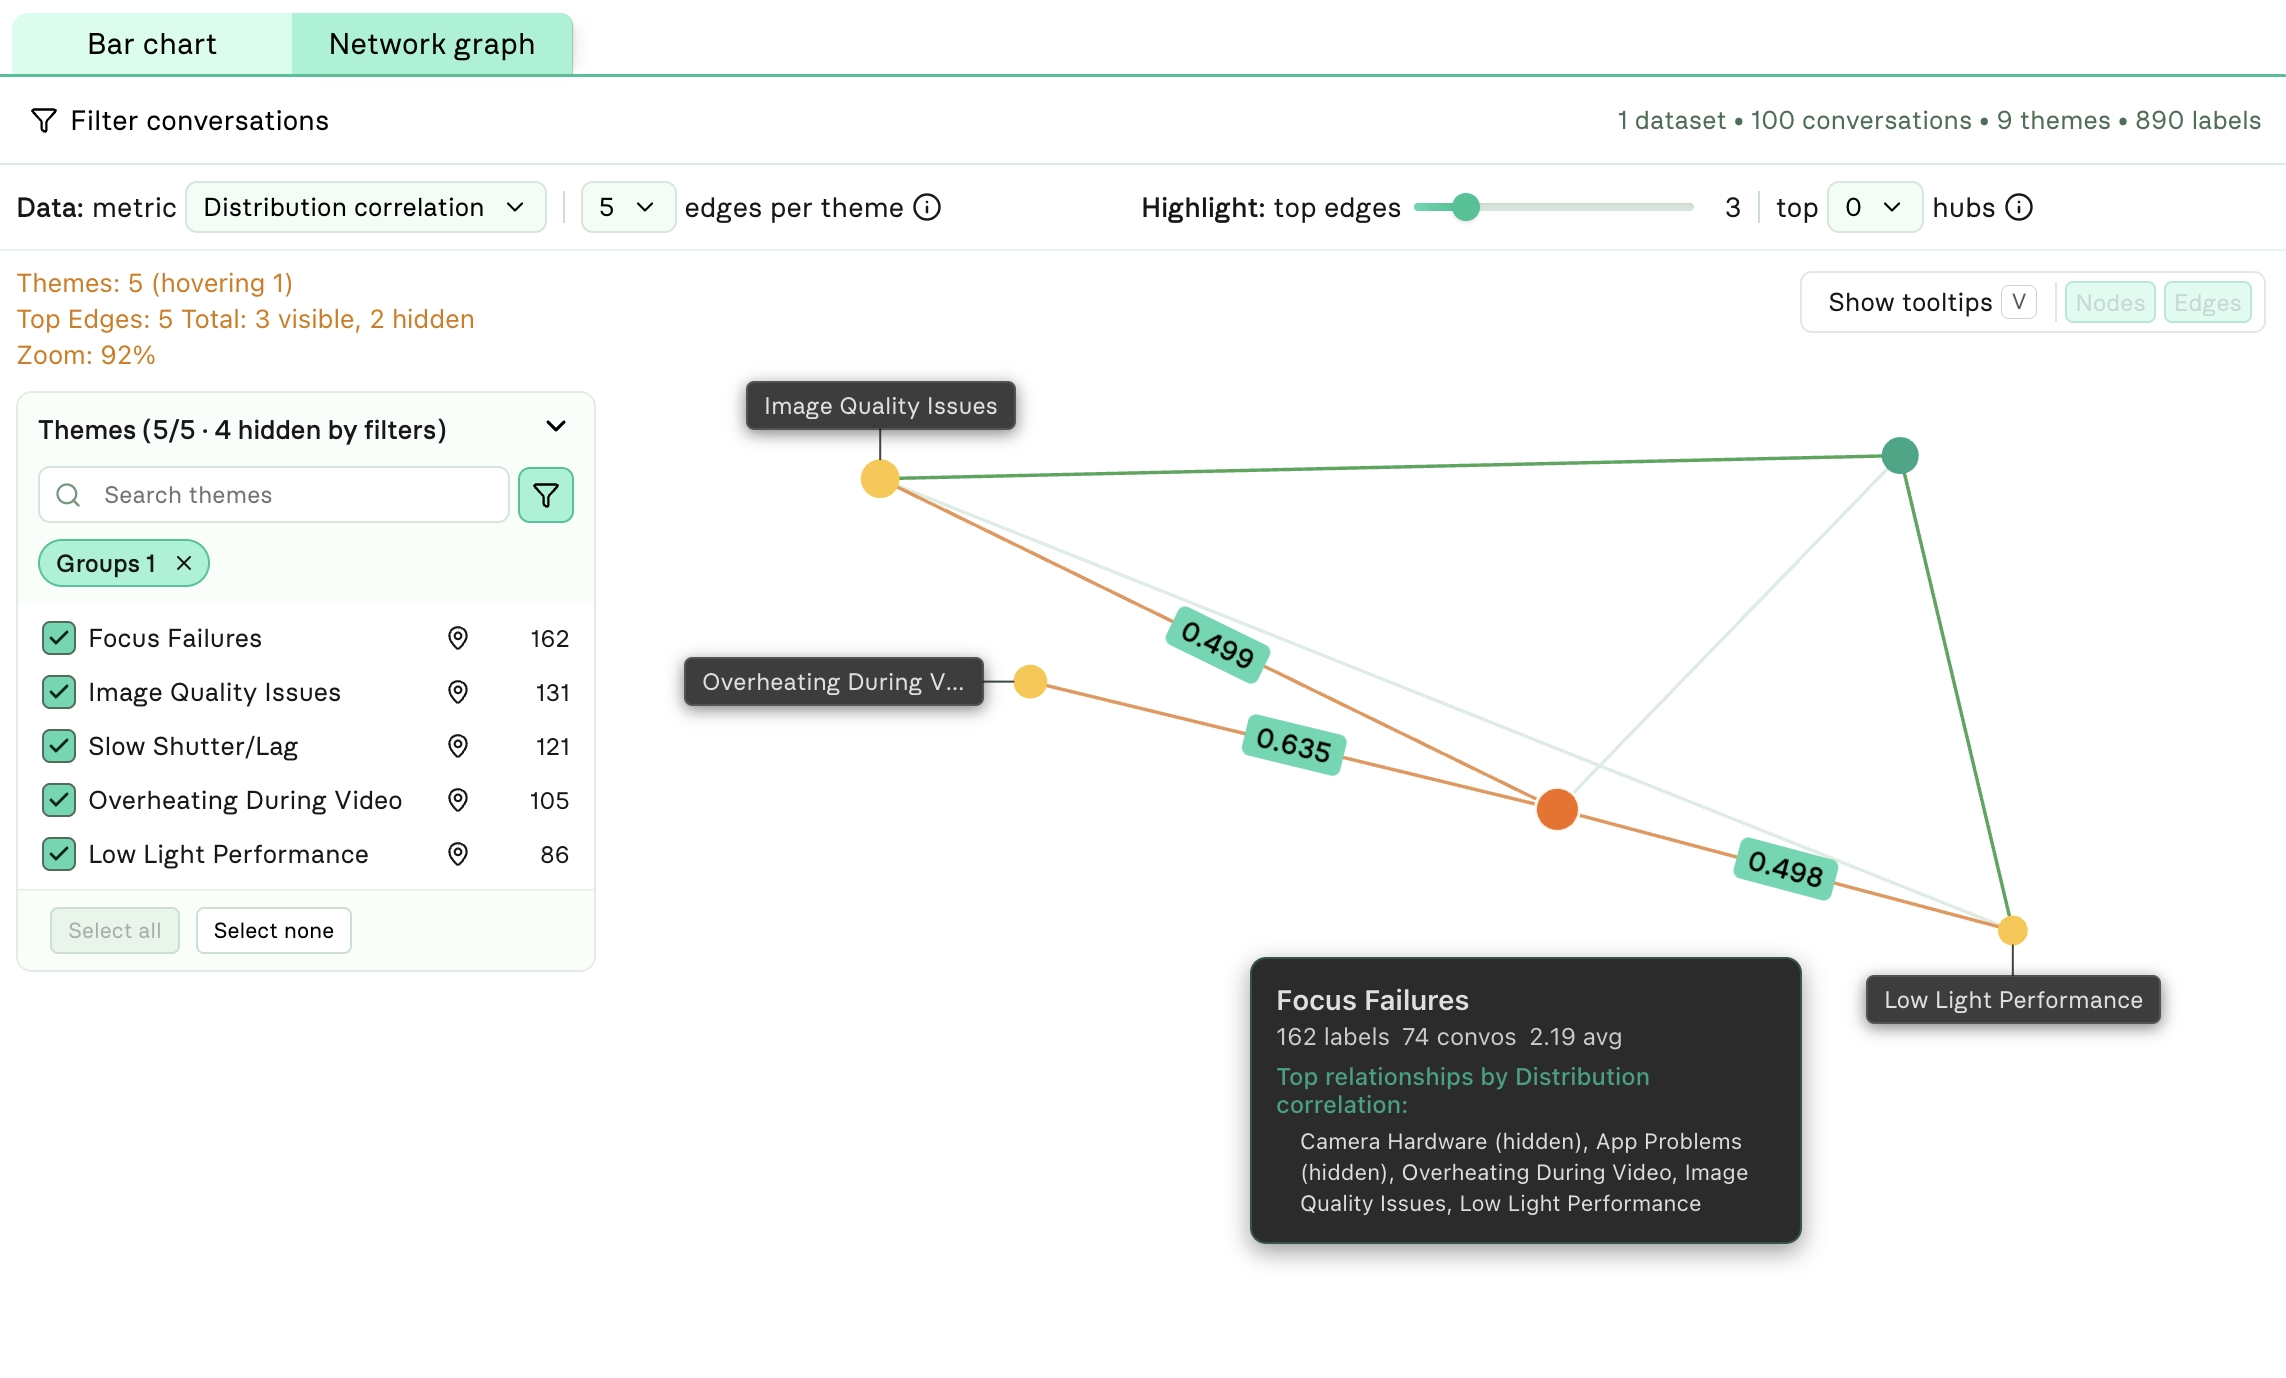
Next, Dottie looks at distribution correlation to see what other themes tend to appear alongside focus issues and how consistently they do so.
- Insight 1: Focus Failure has above average correlation (0.635) with Overheating During Video.
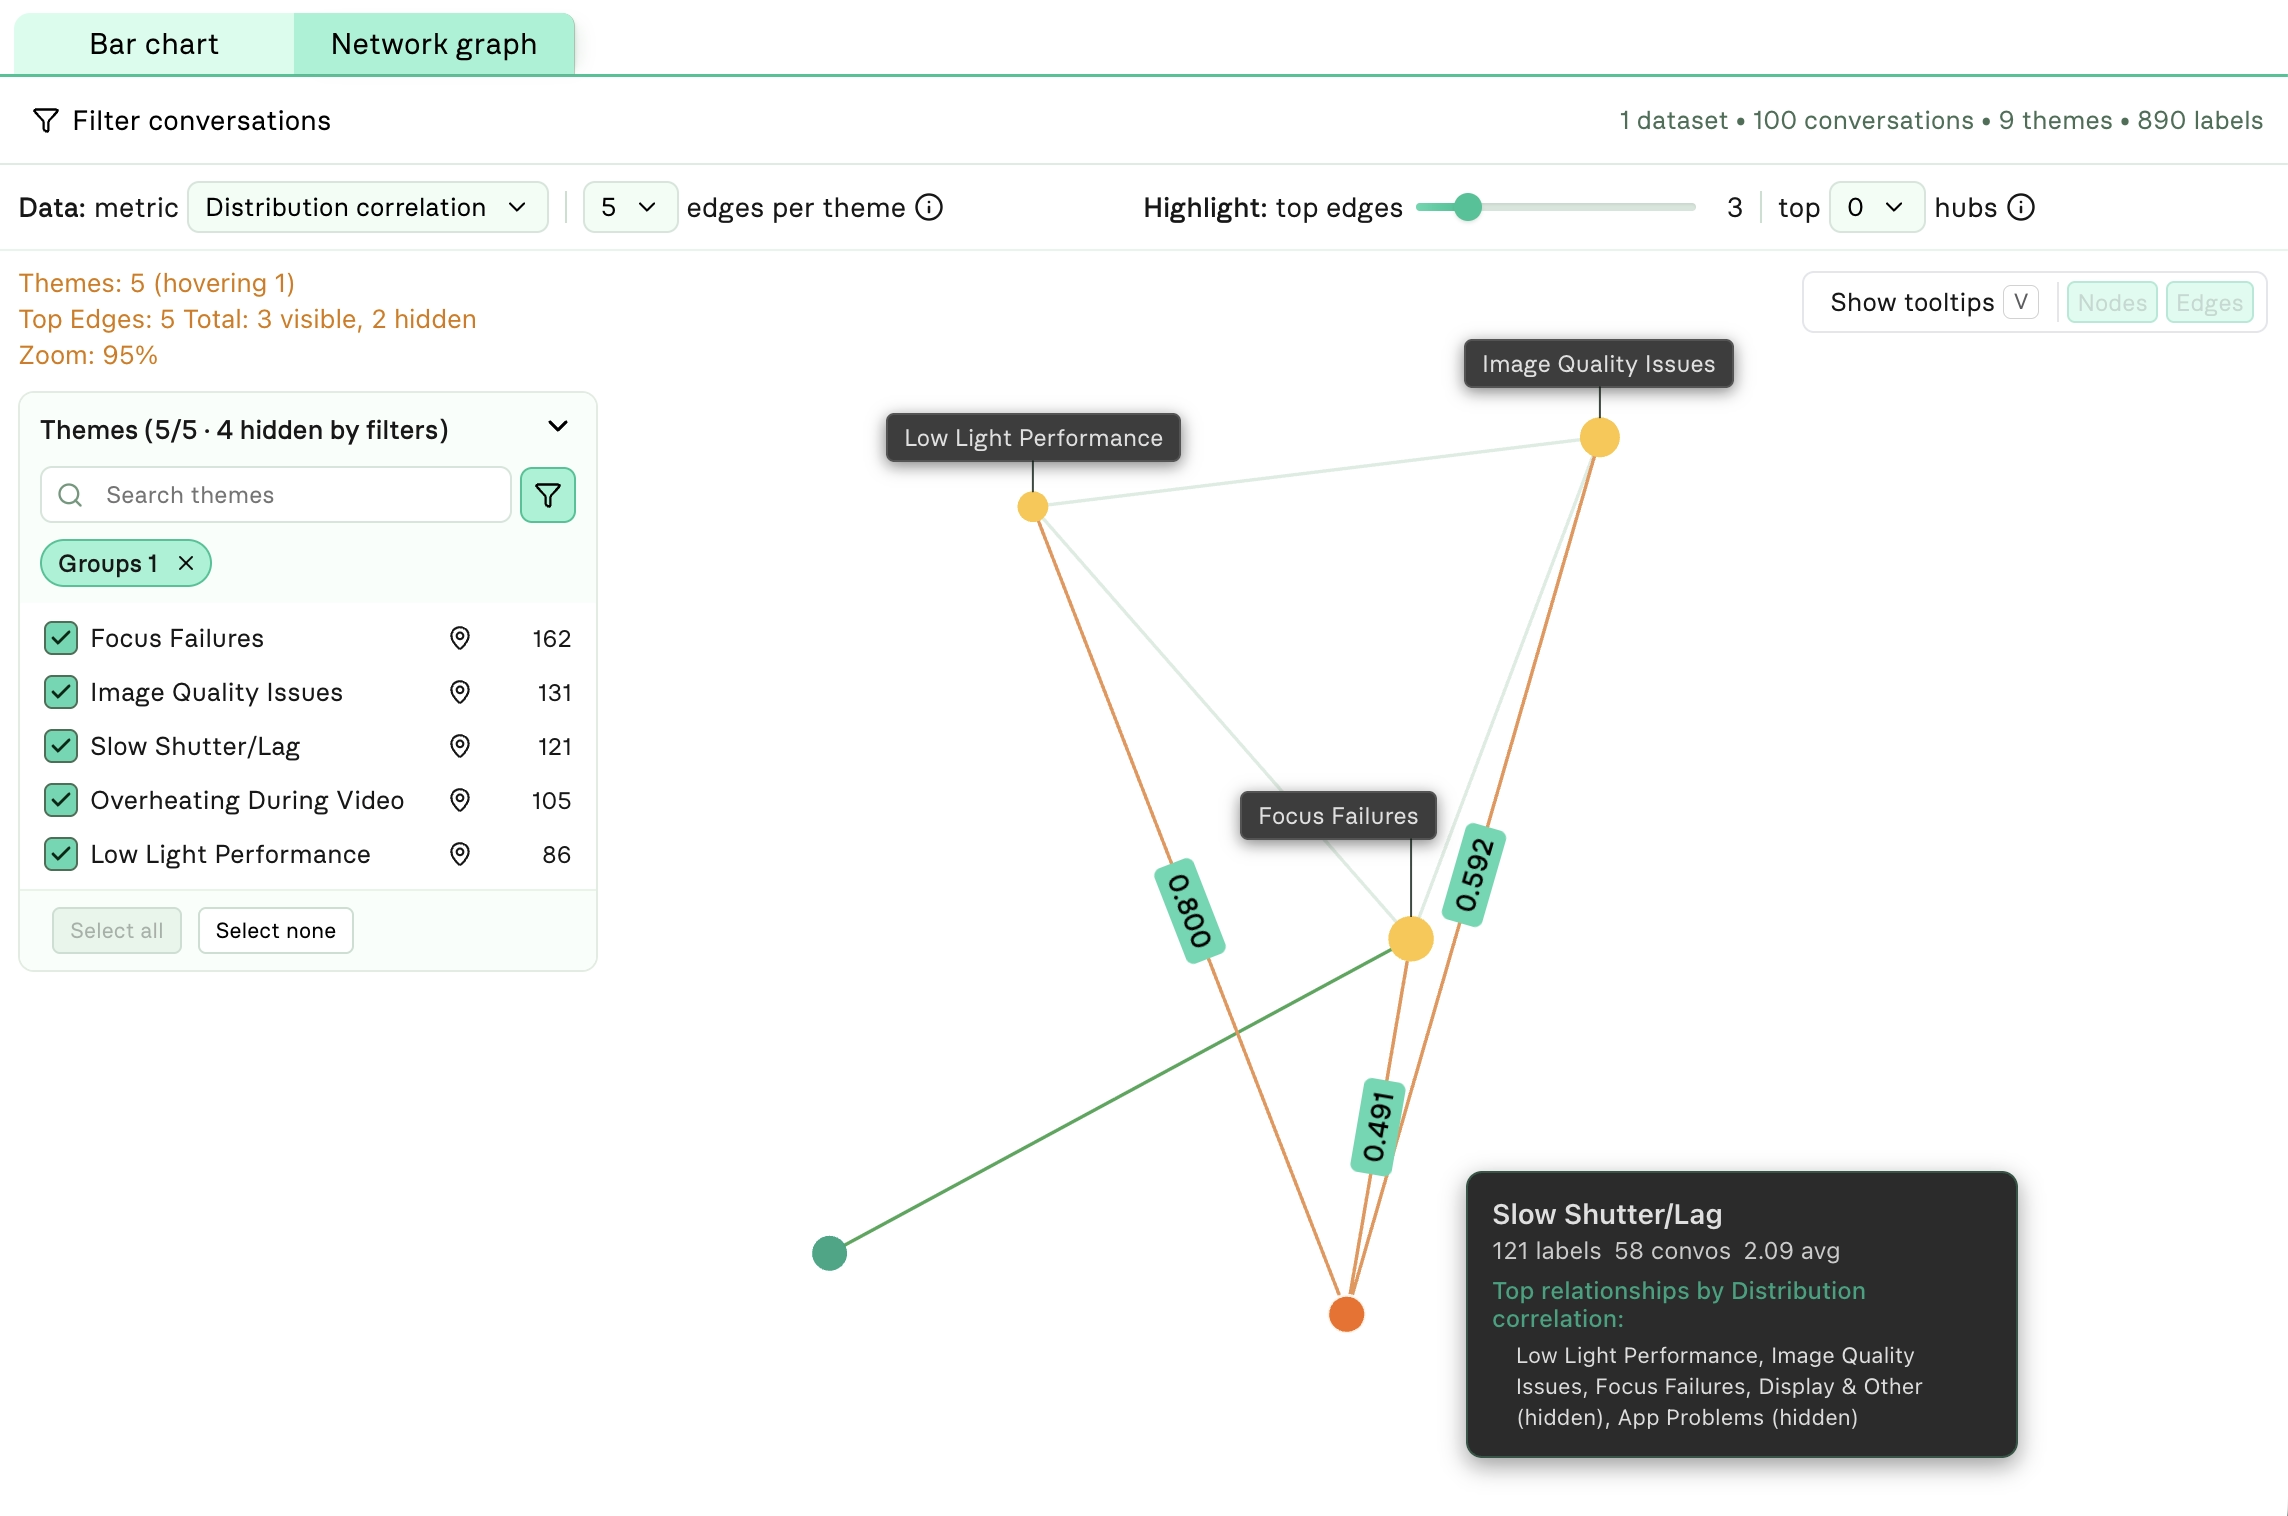
Mousing over the other camera themes, Dottie finds something worth a closer look.
- Insight 2: Slow Shutter/Lag correlates strongly (0.8) with Low Light Performance and above average (0.592) with Image Quality Issues. This points to a new camera problem—one unrelated to Focus Failures.
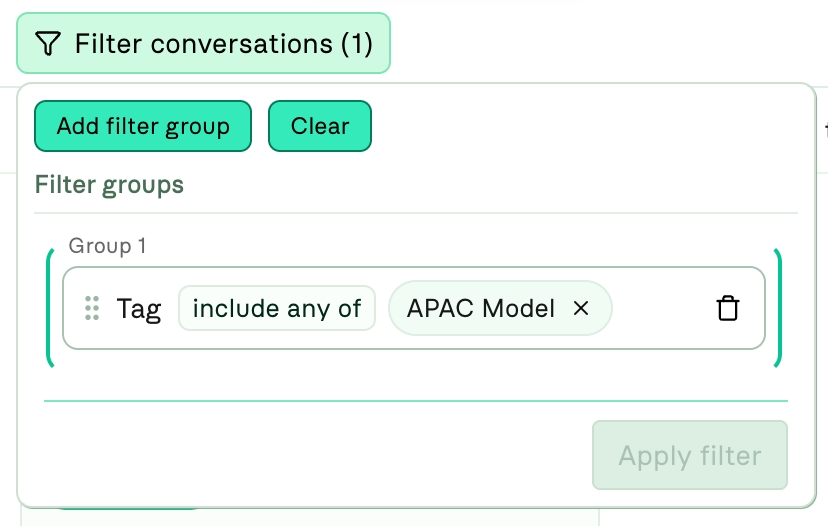
Segmenting by region
Dottie wonders if region plays a role. She segments the dataset by NA vs. APAC to see if the correlation holds up or shifts.
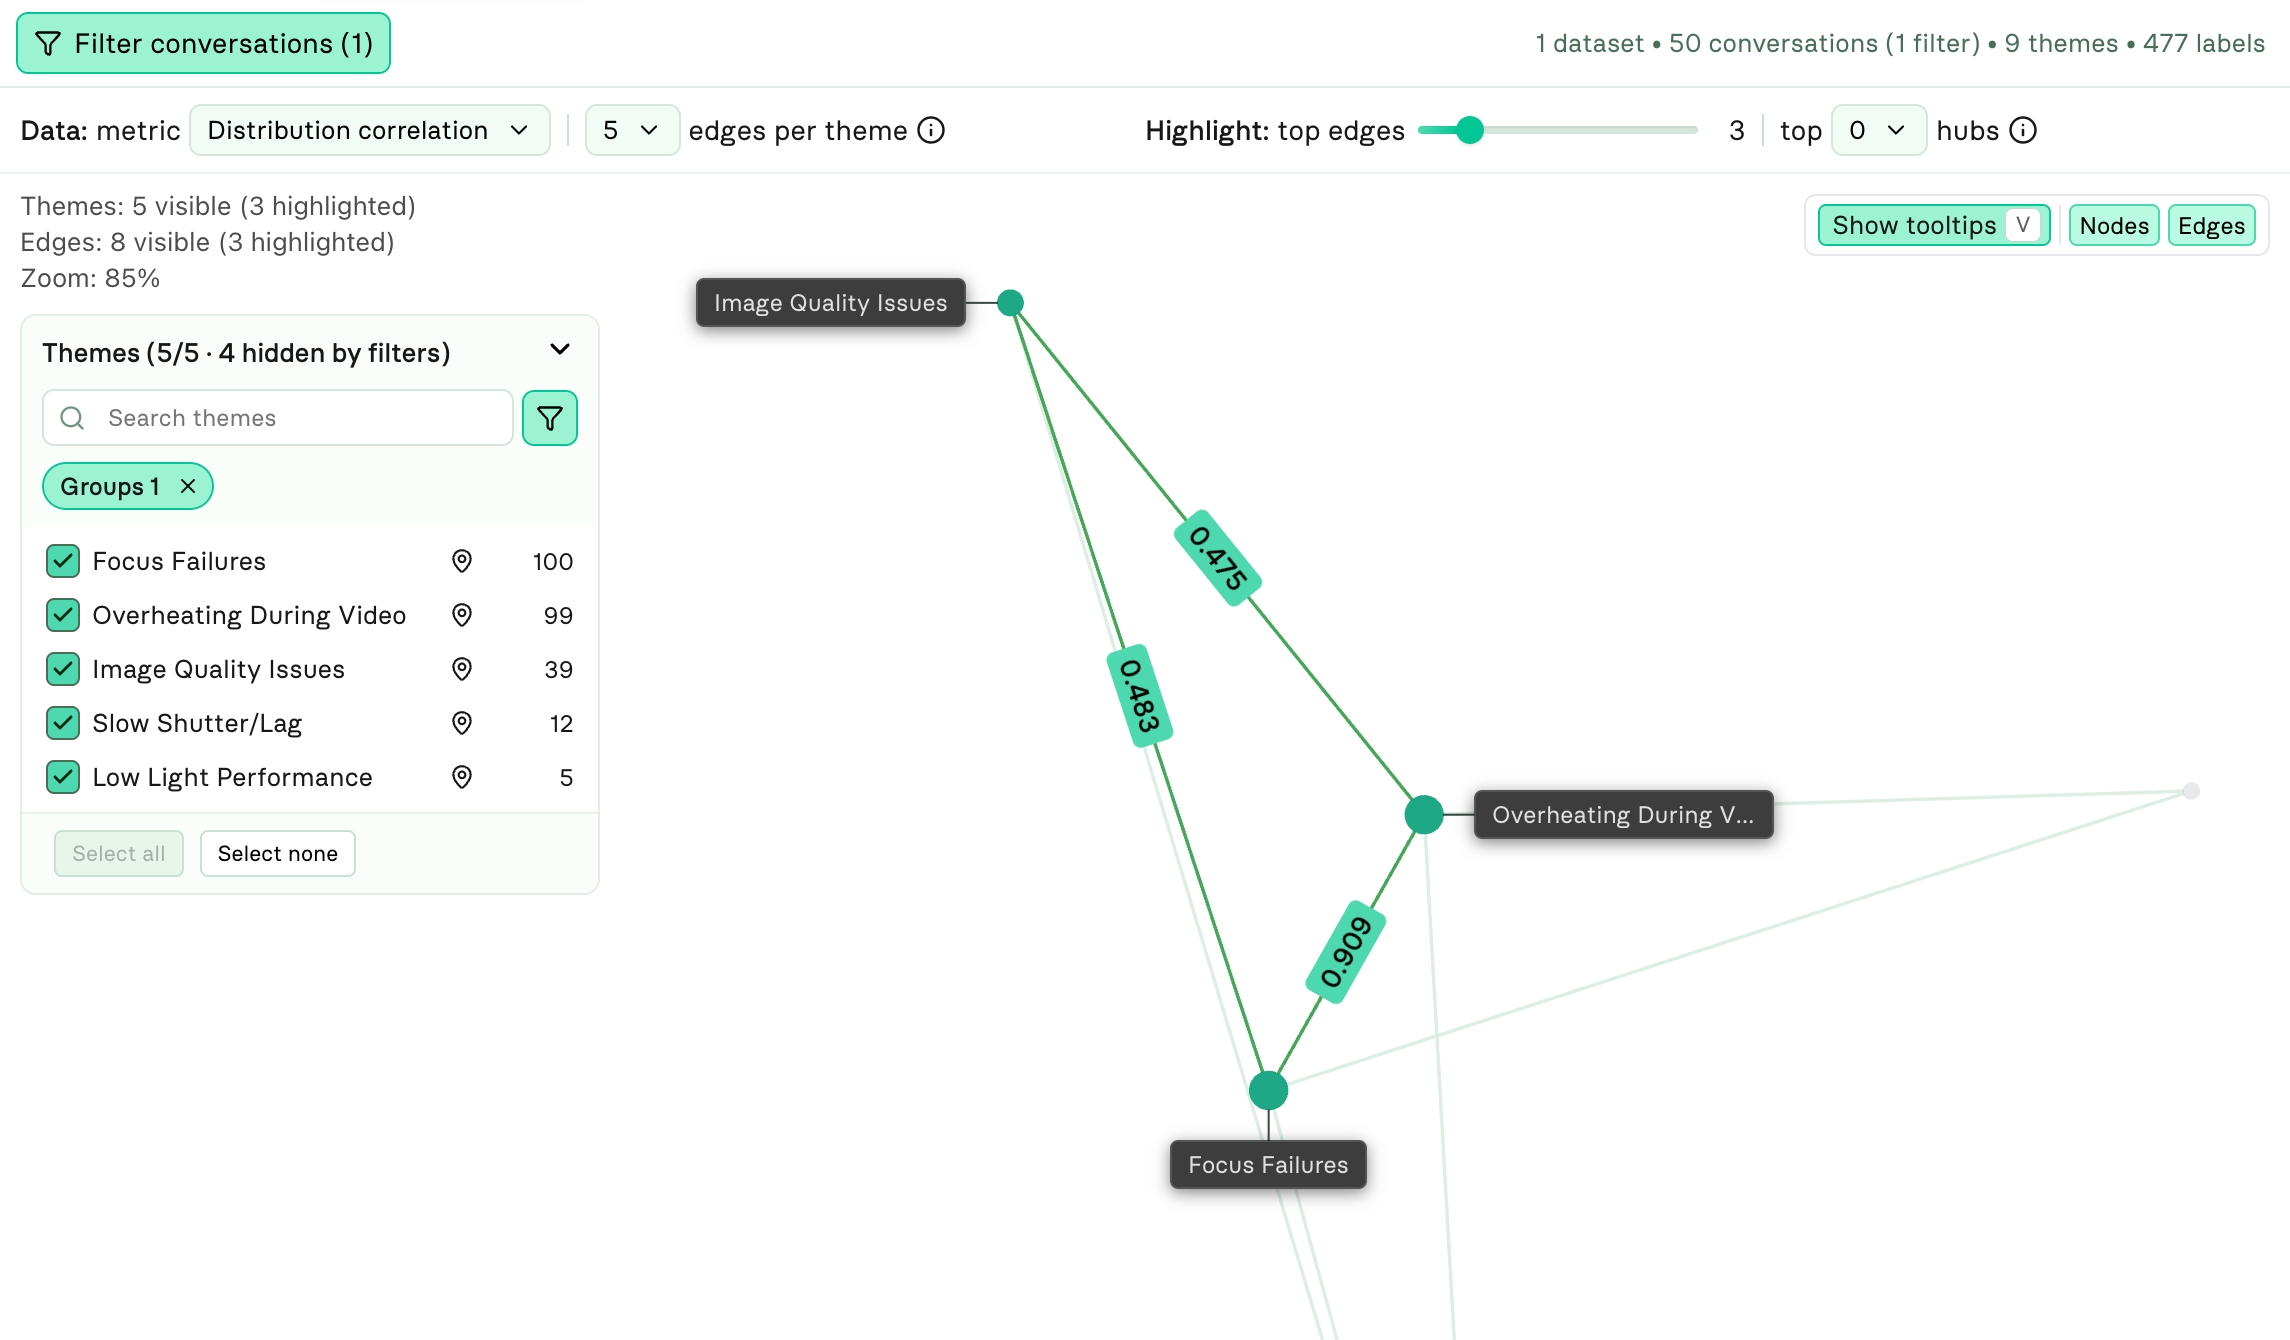
- Insight 3: Focus Failure and Overheating During Video correlate at 0.909 in APAC—a big jump from the 0.635 overall. Slicing by region revealed a much stronger connection, suggesting this is an APAC-specific problem.
North America shows a different story.
- Insight 4: NA's top three correlations are between Image Quality Issues, Slow Shutter/Lag, and Low Light Performance—no focus problems in sight. The data suggests the two regions may be dealing with entirely different camera issues.